
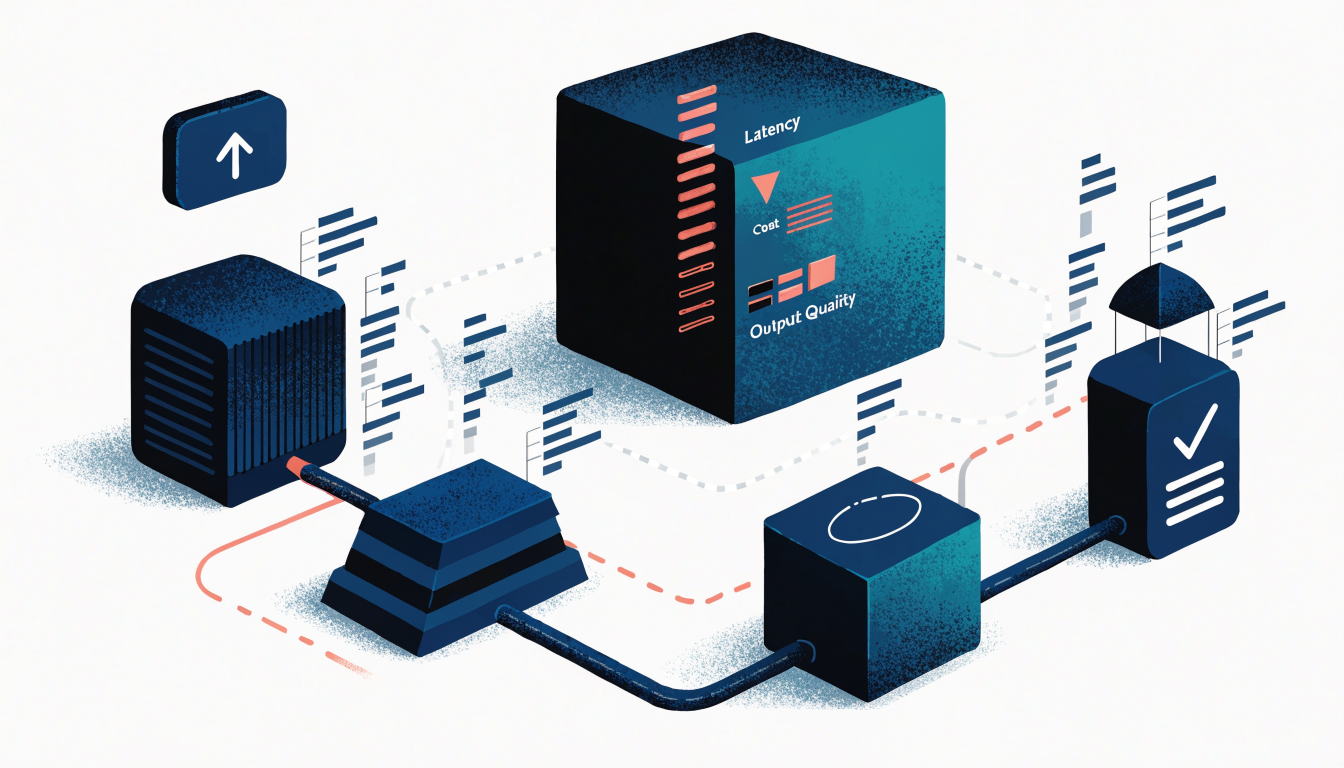
The integration of Large Language Models (LLMs) into production environments has moved rapidly from experimental novelty to core business functionality. However, deploying an LLM is not merely about calling an API; it is about managing a complex, non-deterministic, and often expensive distributed system. When an LLM-powered feature fails, the root cause is rarely a simple code bug. It could be a prompt injection attack, a hallucination stemming from poor retrieval in a Retrieval-Augmented Generation (RAG) pipeline, or simply an unexpected spike in token usage leading to massive cloud bills. This complexity necessitates robust monitoring. If you are searching for the best LLM observability tool, you are looking for more than just logging; you are seeking a comprehensive solution that provides deep, actionable insights into the entire lifecycle of your AI applications.
LLM observability is the practice of collecting, aggregating, and analyzing data generated during the execution of AI models to understand their behavior, performance, and reliability in real-world scenarios. Given the unique challenges of generative AI—such as non-deterministic outputs, high operational costs, and the difficulty in tracing complex multi-step reasoning—a dedicated observability stack is no longer optional. It is a critical component of modern MLOps and AI engineering workflows, ensuring that your models are not only functional but also trustworthy, cost-efficient, and compliant.
Understanding the Core Pillars of LLM Observability
To evaluate any tool, one must first understand what it is measuring. LLM observability extends far beyond traditional application performance monitoring (APM). It addresses three primary, interconnected pillars: operational health, quality assurance, and cost management.
Operational Health and Tracing
In traditional software, tracing a request involves following a single execution path through microservices. In an LLM application, a single user query might trigger a chain of events: a vector database lookup, a prompt template application, an API call to a model provider (like OpenAI or Anthropic), and then a post-processing step. Effective tracing allows developers to visualize this entire journey, pinpointing exactly where latency is introduced—whether it’s in the database retrieval, the prompt construction, or the LLM inference itself. Tools must provide detailed trace spans for each step, allowing you to see the “time-to-first-token” versus the “total response time.”
Quality and Reliability Metrics
The most significant challenge with LLMs is their non-deterministic nature. Two identical prompts can sometimes yield slightly different results. Observability tools must go beyond simple latency and error rates to measure the quality of the output. This involves tracking metrics like:
- Hallucination Rate: Identifying instances where the model confidently provides factually incorrect information.
- Prompt Adherence: Measuring if the model followed the instructions provided in the system prompt.
- Semantic Similarity: Comparing the model’s output against a known “golden” answer or a set of expected constraints.
- Guardrail Violations: Detecting attempts at prompt injection or the generation of harmful content.
These metrics require sophisticated data collection and often involve running automated evaluation pipelines alongside production traffic.
Cost and Token Management
LLM usage is directly tied to token consumption. Unlike traditional software where CPU and memory usage are the primary cost drivers, LLM costs are driven by the number of input tokens (prompt) and output tokens (completion). A single poorly optimized prompt or an infinite loop in a complex agent can lead to unexpected and astronomical bills. Robust cost monitoring is therefore a non-negotiable feature. The best tools provide granular breakdowns, showing exactly how many tokens were consumed per request, which model was used, and the associated cost, allowing engineers to optimize prompts and reduce unnecessary API calls.
Key Challenges in Implementing LLM Observability
Before selecting a tool, it is crucial to understand the technical hurdles involved. These challenges dictate the features you should prioritize in your chosen solution.
The Fragmentation of the AI Stack
Modern AI applications are rarely monolithic. They often involve a complex stack: a frontend, a backend orchestration layer (like LangChain or LlamaIndex), a vector database, a caching layer, and multiple external LLM providers. Each component generates its own logs and metrics. A major challenge is data normalization. A good observability tool must be able to ingest, standardize, and correlate data from these disparate sources into a single, coherent view of the request lifecycle.
Context Window Management
LLMs operate within a limited context window. As applications become more complex, the context passed to the LLM grows. Observability tools need to be able to log and analyze the content of the context window—not just its size. This is vital for debugging “context overflow” errors or identifying when the model is being fed irrelevant or redundant information, which wastes tokens and degrades performance.
The Non-Deterministic Nature of Output
Because LLMs are probabilistic, you cannot rely on simple unit tests for every output. Observability tools must facilitate continuous evaluation. This means the system needs to be able to capture the input, the model’s raw output, and the resulting evaluation score, allowing developers to retrospectively analyze why a specific output was deemed “bad” without having to re-run the entire pipeline manually.
Open-Source Versus Managed Platform Approaches
The market for LLM observability is rapidly maturing, offering solutions that range from open-source frameworks to comprehensive, managed platforms. Rather than endorsing specific vendors, this article focuses on the two dominant architectural approaches, because the right choice depends entirely on your team’s size, technical expertise, existing infrastructure, and budget.
Open-Source Framework Approaches
For developers who prefer granular control and wish to avoid vendor lock-in, open-source solutions are highly attractive. LangChain and LlamaIndex themselves offer built-in tracing capabilities, often leveraging standards like OpenTelemetry.
- Pros: Zero cost, maximum flexibility, and deep integration with the frameworks you are already using.
- Cons: Requires significant engineering effort to set up, maintain, and visualize the data. You are responsible for building the dashboard and the alerting logic.
A common pattern involves using OpenTelemetry to instrument your LLM calls. For example, when using a library like LangChain, you can configure it to emit spans for each step (e.g., retriever, prompt_template, llm_call). This allows you to export that data to a standard tracing backend like Jaeger, Zipkin, or Grafana Tempo. (Prometheus, by contrast, is a metrics backend; it pairs well with tracing but does not store trace spans.)
# Conceptual example of instrumented LLM call using OpenTelemetry principles
import time

from opentelemetry import trace
from langchain_openai import ChatOpenAI

tracer = trace.get_tracer(__name__)
llm = ChatOpenAI(model="gpt-4")

with tracer.start_as_current_span("llm_request_pipeline") as span:
    # Step 1: Prompt construction
    with tracer.start_as_current_span("prompt_generation") as prompt_span:
        prompt = "Explain quantum computing simply."
        # Log prompt details to the span
        span.set_attribute("prompt.text", prompt)

    # Step 2: LLM Inference
    with tracer.start_as_current_span("llm_inference") as inference_span:
        start_time = time.perf_counter()
        response = llm.invoke(prompt)
        latency_ms = (time.perf_counter() - start_time) * 1000
        # AIMessage exposes token usage via usage_metadata
        usage = response.usage_metadata
        span.set_attribute("tokens.used", usage["total_tokens"])
        span.set_attribute("latency.ms", round(latency_ms, 2))
Managed Platform Solutions
For enterprise-level deployments, dedicated managed platforms offer a “batteries-included” experience. These tools specialize in the unique challenges of LLMs, providing pre-built dashboards, automated cost tracking, and integrated evaluation suites.
- Pros: Rapid deployment, comprehensive feature set (cost, quality, latency), and centralized data management.
- Cons: Subscription costs can be high, and they introduce a dependency on a specific vendor’s ecosystem.
When evaluating these platforms, look for features that automate the collection of LLM-specific metadata, such as the specific model version used, the temperature setting, and the full input/output payload, which is often too large for standard logging but essential for debugging.
Decision Criteria: Choosing the Right Tool for Your Use Case
Selecting the best LLM observability tool requires a pragmatic approach. Do not choose based on marketing hype; choose based on your operational reality.
1. Complexity of the AI Workflow
If your application is a simple wrapper around a single API call (e.g., “summarize this text”), a basic logging solution might suffice. However, if you are building complex RAG pipelines or multi-agent systems, you need a tool that can trace the flow of data between the vector store, the prompt, and the LLM. These complex workflows demand high-fidelity, multi-step tracing.
2. Evaluation Requirements
If your business requires high reliability (e.g., medical or financial applications), you cannot rely solely on latency metrics. You must prioritize tools that integrate automated evaluation. These tools should allow you to define quality benchmarks (e.g., “the answer must contain the keyword ‘carbon'”) and automatically score production outputs against those criteria.
3. Cost Sensitivity
If token costs are a primary concern, the tool must offer precise, granular cost attribution. It should allow you to filter costs by model, by specific user, or even by the prompt template used, enabling targeted cost-reduction efforts.
4. Integration and Ecosystem
Consider your existing tech stack. If you are heavily invested in the Vercel platform or using specific cloud providers, look for tools that offer seamless integration with those environments. Furthermore, check for compatibility with industry standards like OpenTelemetry to ensure future flexibility.
Best Practices for Implementing LLM Observability
Implementing observability is not a one-time setup; it is an ongoing engineering discipline. Adopting these best practices will maximize the value of your chosen tool.
Standardize Prompt Logging
Never treat the prompt as a simple string. Log it as a structured object containing:
- The system prompt (the instructions).
- The user input (the query).
- The context (retrieved documents or data).
- The metadata (temperature, top-p, model version).
This structured logging is the only way to effectively debug a hallucination or a prompt injection attempt.
Implement Automated Guardrail Testing
Observability should be paired with proactive testing. Use your monitoring data to identify failure modes (e.g., “the model often refuses to answer when the context is too short”). Then, use this knowledge to implement guardrails—either at the input level (pre-processing) or the output level (post-processing)—to prevent these failures from reaching the end-user.
Define Clear SLO/SLIs for AI
Traditional Service Level Indicators (SLIs) like “99.9% uptime” are insufficient for LLMs. Define AI-specific SLO/SLIs. For example:
- Latency SLI: 95% of responses must be generated within 3 seconds.
- Quality SLI: 90% of responses must pass the automated factual consistency check.
- Cost SLI: Average cost per user query must not exceed $0.05.
By defining these metrics, you transform your observability tool from a passive logger into an active component of your SRE (Site Reliability Engineering) strategy.
Frequently Asked Questions
Traditional logging focuses on infrastructure health and execution flow (e.g., “Database connection failed,” “HTTP 500 error”). LLM observability focuses on the *quality* and *behavior* of the generative output. It tracks metrics like token consumption, prompt adherence, hallucination rates, and the semantic coherence of the response, which are entirely absent in standard application monitoring.
This depends on your team’s resources and operational maturity. If you have a small team, limited budget, and high engineering expertise, an open-source solution using OpenTelemetry is ideal for maximum control. If you are an enterprise, prioritizing speed of deployment, comprehensive feature sets, and reduced operational overhead, a managed platform is generally the better choice.
The best tools integrate with the APIs of major providers (OpenAI, Anthropic, etc.) or provide custom logging hooks. They capture the `usage` object returned by the LLM API, which contains the count of input and output tokens. By mapping these counts to the current market price per token for that specific model, the tool automatically calculates the cost per request, allowing you to pinpoint expensive prompts or models.
While observability tools are primarily for *detection* and *analysis*, they are crucial for prevention. By logging and analyzing the input prompts, they can flag suspicious patterns (e.g., attempts to override system instructions) that indicate a prompt injection attack. This data then informs the development of robust input validation and guardrail layers.
Conclusion
The complexity of deploying Large Language Models in production demands a sophisticated monitoring strategy. The best LLM observability tool is not merely a logging utility; it is a comprehensive system that provides visibility into the operational health, financial cost, and qualitative performance of your AI features. By prioritizing tools that offer deep tracing, automated cost attribution, and integrated quality metrics, you move beyond simply “making it work” to ensuring that your AI applications are reliable, scalable, and trustworthy. The next logical step is to audit your current AI workflows and select a tool that addresses your most critical pain point—be it cost overruns, unpredictable latency, or inconsistent output quality.
Transparency Note: Links in this article are not affiliate links. I recommend these tools and platforms based on their relevance to the topic, and no compensation is received for including them.